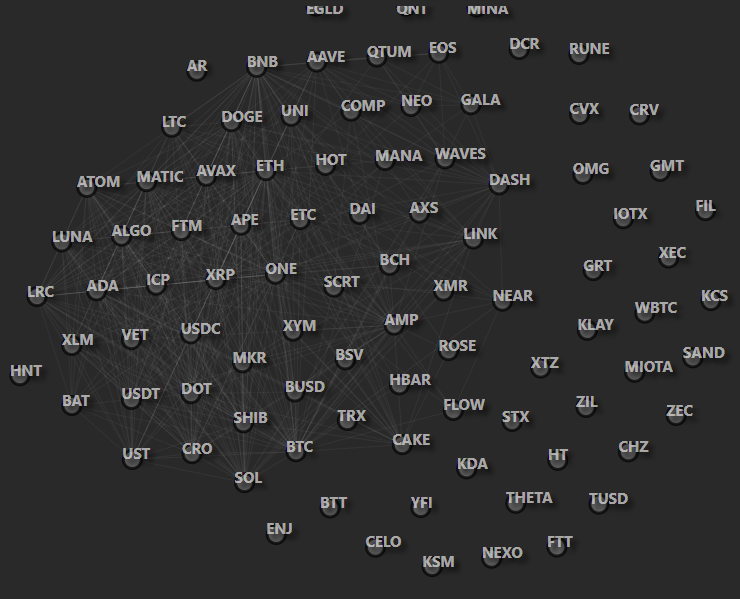
The keyword network Diagram, will show inter-relationships of between different crypto currencies, click on one to see more data!
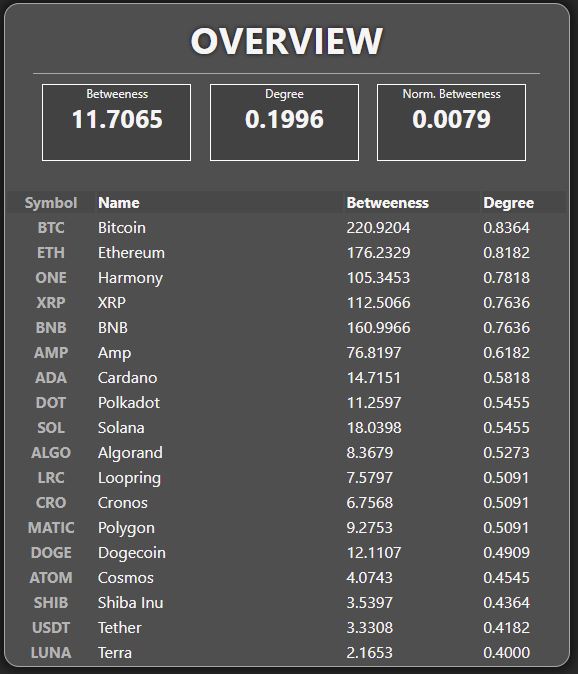
The data from the Keyword Network Diagram will initially provide an overview with a list of coins and
how many connections there are with other nodes(betweenness) and degree which is based on number of edges.
When selected on a specific coin from the keyword network diagram, it will show specific information
such as where the X coin is mentioned and if other coins were mentioned on a similar reddit posts
as well with it. Along with a count of the number of post for the purposed coin.

The Cyclic coin information shows a list of 5 coins that are constantly refreshing,
if you see you're desired coin here, click it to view more information!
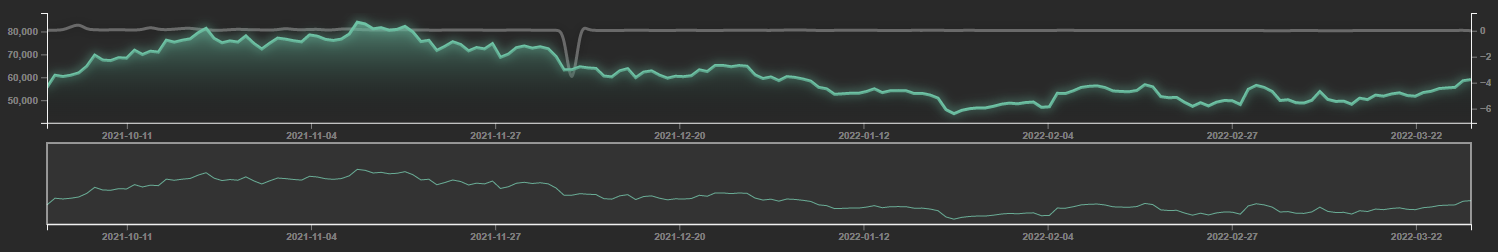
The Coin Chart Data will show a 1 year past timeline of the specified coin price opening day price on a
neon coloured line chart with price on the left edge of the chart. The white line will show the overall
sentiment score with the scale on the right edge of the chart.
Tip: Zoom in on the top chart to go get a better look at a specific time frame, and use the bottom chart to scroll.
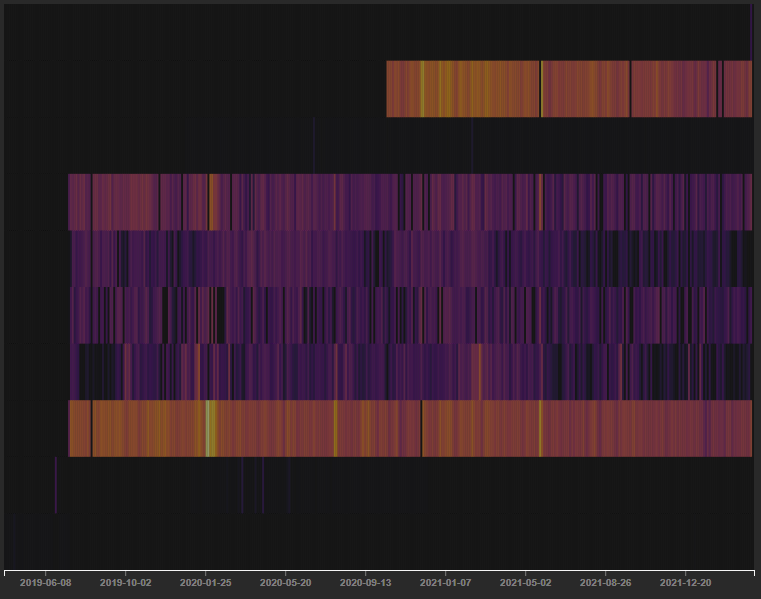
The Heat map will show a concentration of sentiment score of the selected coin on a specific day from a list of subreddits that include:
1. r/ico
2. r/CryptoCurrency
3. r/wallstreetbets
4. r/btc
5. r/Crypto General
6. r/CryptoMarket
7. r/CryptoCurrencyTrading
8. r/Bitcoin
9. r/BlockChain
10. r/icocrypto
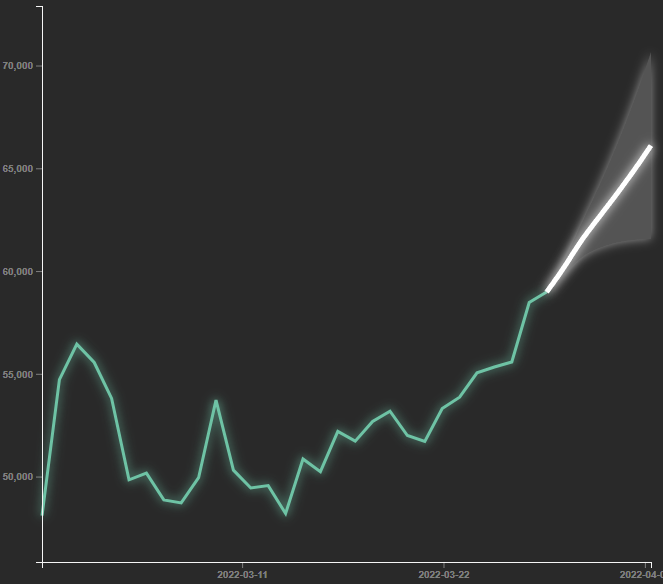
When specificed on a certain coin the coin chart data will show the opening price of a crypto coin, along with the future
prediction of the estimated value range of coin for the future shown in white that is calculated with vector auto regression.